
Monitoring the availability and health of on-premises application using AWS CloudWatch Synthetics
Amazon CloudWatch is a monitoring and observability service that provides you with data and actionable insights to monitor your applications, respond to system-wide performance changes, and optimize resource utilization. You can utilize various CloudWatch capabilities to monitor the health of your application that is available over the internet, or resides within an Amazon Virtual Private Cloud (Amazon VPC) or in an on-premises network.
Utilize CloudWatch Synthetics to create canaries, which are configurable scripts that run on a schedule to monitor the health of your endpoints and APIs. Canaries create Lambda functions in your account that use Node.js or Python as a framework. They check the availability and latency of your endpoints and can store load time data. You can monitor your REST APIs, URLs, and website content, as well as check for unauthorized changes from phishing, code injection, and cross-site scripting. In the following sections, this post provides a solution for customers to monitor the availability and health of their on-premises application using CloudWatch Synthetics. This solution requires Amazon VPC to be connected to the on-premises network either via AWS Site-to-Site VPN or AWS Direct Connect connection.
Solution overview
The following figure shows an architecture diagram for setting up a Synthetics canary to monitor the application inside of an on-premises network. It also shows network traffic flow from the Synthetics canary to the application. The VPC doesn’t have internet access enabled. If the DNS for the private application is hosted in an on-premises network, then the customers can utilize Route53 resolver outbound endpoint to forward DNS requests to the on-premises DNS servers.
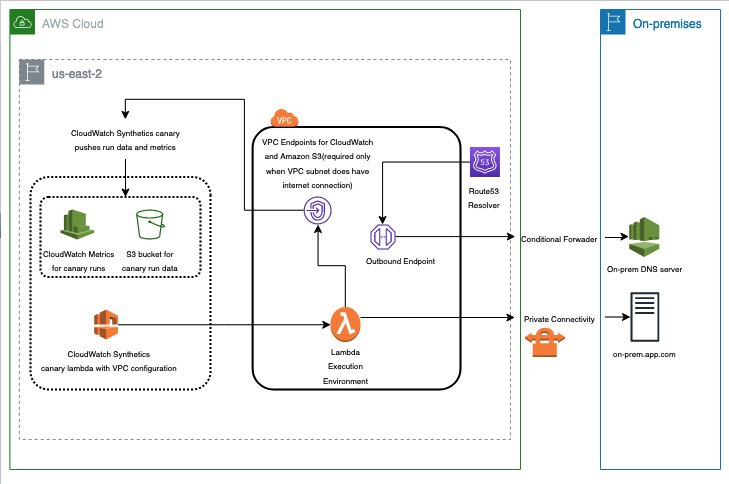
Figure 1. Architecture overview of setting CloudWatch Synthetics in Amazon VPC with a hybrid DNS environment
Solution implementation
The solution consists of the following three parts:
PART A. Creating a Heartbeat Canary using CloudWatch Synthetics.
PART B. Enabling Hybrid DNS between Amazon VPC and on-premises (optional).
PART C. Viewing Canary run metrics.
PART A: Creating a Heartbeat Canary using CloudWatch Synthetics
Step 1: VPC connection with on-premises
Create VPC if one isn’t already configured, and then note the VPC ID, private subnet IDs, and security group IDs for later use when configuring the Synthetics canary. Make sure that this VPC has private connectivity with the on-premises network (where the application is hosted). The private connection can be either Site-to-Site VPN or Direct Connect. If no private connection with on-premises exists, then create one using setting up VPN or setting up Direct Connect in AWS.
Step 2: Enable Internet access/VPC endpoints for VPC
- If VPC has internet access enabled, then create public NAT Gateway, add it to VPC, and skip to Step 3.
- If VPC does not have internet access enabled, then follow these steps:
- Create Amazon S3 VPC Endpoint to store Synthetics canary run data and create CloudWatch VPC Endpoint with com.amazonaws.region.monitoring as the service name to collect Synthetics canary run metrics. Enable VPC DNS resolution and hostnames.
Step 3: Configure canary details
- Navigate to Create canary page on the AWS Management Console.
- Select Use a blue print and Heartbeat monitoring blue print.
- Enter a Name for the canary.
- Enter your Application or endpoint URL or the dummy endpoint that we created (Select the http:// option if you’re using the dummy endpoint).
- (Optional) Schedule: Use the default or select your desired schedule.
- (Optional) Data Retention: Use defaults or select your desired retention period for this canary’s run results.
- (Optional) Data Storage: Leave this empty or select an Amazon Simple Storage Service (Amazon S3) folder where you would like to store the artifacts created by each canary run.
- (Optional) Access Permissions: Use Create a new role or provide your own role with the required permissions (Synthetics console will create a new role that includes all of the necessary permissions to run the canary. If you selected your own S3 bucket, then you must select an existing role.) .
- (Optional) CloudWatch Alarms: If your canary detects any issues, then you can set alarms to get notified.
Step 4: Configure VPC settings
- Select Virtual Private Cloud (VPC) that has connectivity with the on-premises network.
- Select one or more private subnets from Subnets options (at least two subnets are recommended for high availability). Make sure that the subnet route tables have a route to the on-premises network via Virtual Private Gateway (VGW) or AWS Transit Gateway.
- Select one or more security groups from the Security groups options.
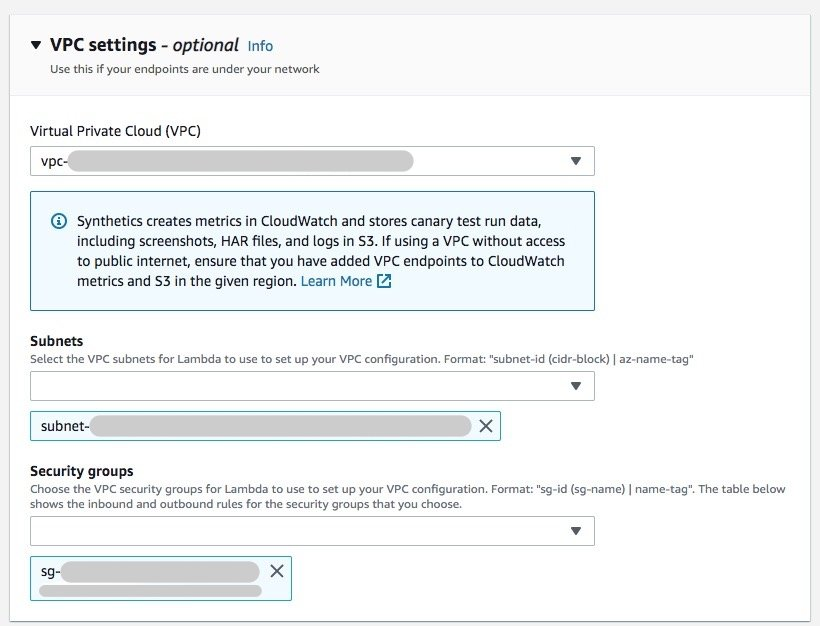
Figure 2. How to Configure VPC Settings for CloudWatch Synthetics
Step 5: Create canary
- Select Create canary
(This step should take approximately one minute to process. Wait until the canary is created and started.)
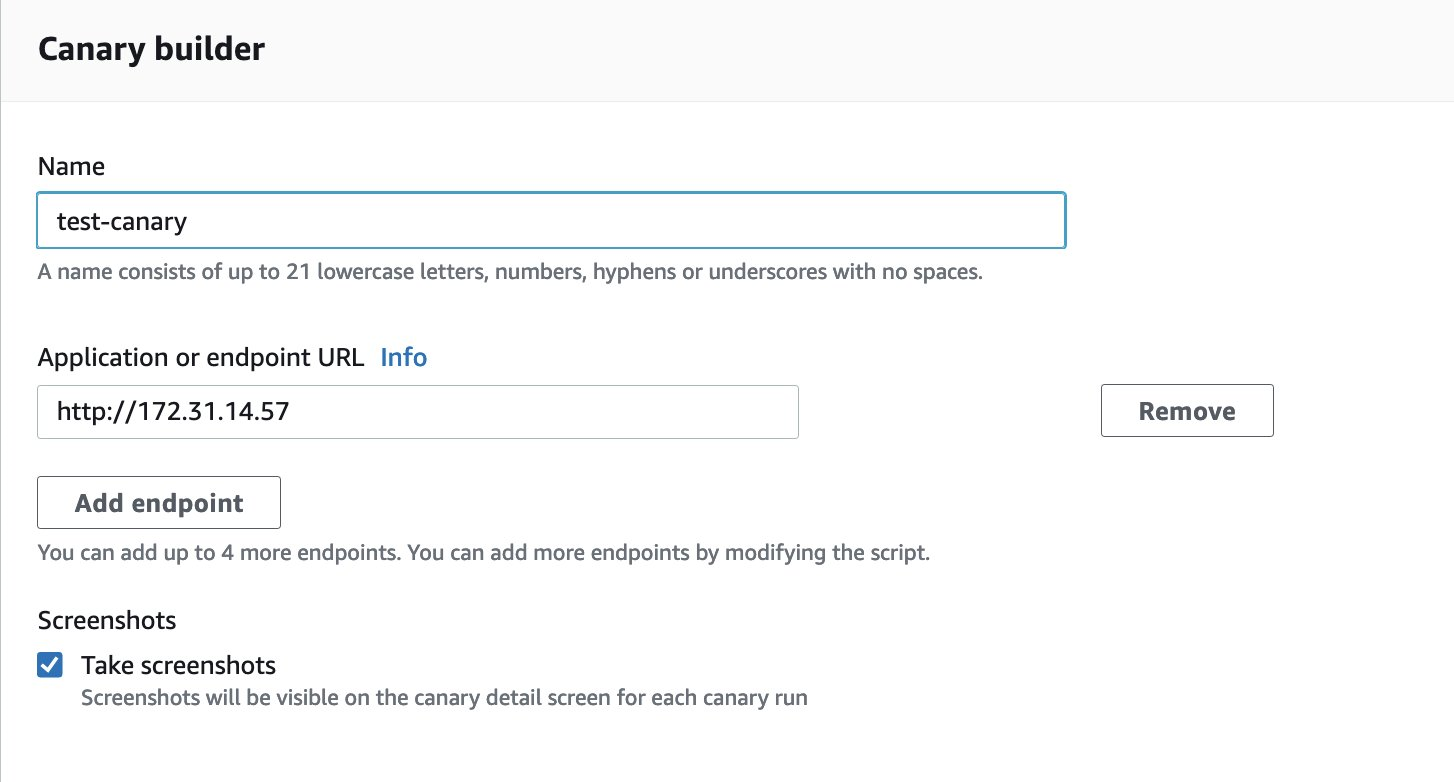
Figure 3. Canary Builder in CloudWatch Synthetics
PART B: Enabling Hybrid DNS between Amazon VPC and on-premises (optional)
This part is only needed if you specify a Fully Qualified Domain Name (FQDN) of the application under endpoint URL, and the FQDN can be only resolved by on-premises DNS servers. For testing purposes, you can also specify private IPv4 address of your on-premises application under endpoint URL – see the following figure.
Step 1: Create Route 53 Outbound Endpoint
- General settings for outbound endpoint:
- Endpoint name: <outbound-endpoint-name>
- VPC in the Region: <AWS-Region-of-VPC: <PART-A-Step-1-VPC>
- Security group for this endpoint: <VPC-Security-Group>
- IP addresses:
1. IP address #1:
i. Availability Zone: <Select-AZ-1>
ii. Subnet: <Private-Subnet-AZ-1>
iii. Select Use an IP address that is selected automatically
2. IP address #2:
i. Availability Zone: <Select-AZ-1>
ii. Subnet: <Private-Subnet-AZ-1>
iii. Select Use an IP address that is selected automatically
3. Select Create outbound endpoints.
Step 2: Create Route 53 Conditional Forwarding Rules.
- Rule for outbound traffic:
1. Name: <outbound-rule-name>
2. Rule type: Forward
3. Domain name: <On-premises application FQDN)
4. VPCs that use this rule – optional: <PART-A-Step-1-VPC
5. Outbound endpoint: <PART-B-Step-1-Outbound-Endpoint>
- Target IP address:
1. <On-Premise-DNS-Server-IP-Address-01>Port: 53
2. Select Add target.
3. <On-Premise-DNS-Server-IP-Address-02>Port: 53
4. Select Submit.
PART C: Viewing Canary run metrics
Navigate to the canary details page by selecting the canary from the canaries list page. (You should see that the canary is in Running state). The following figure shows the successful configuration of Synthetic canaries that can reach the on-premises application and results in metrics that are populating in near real-time.
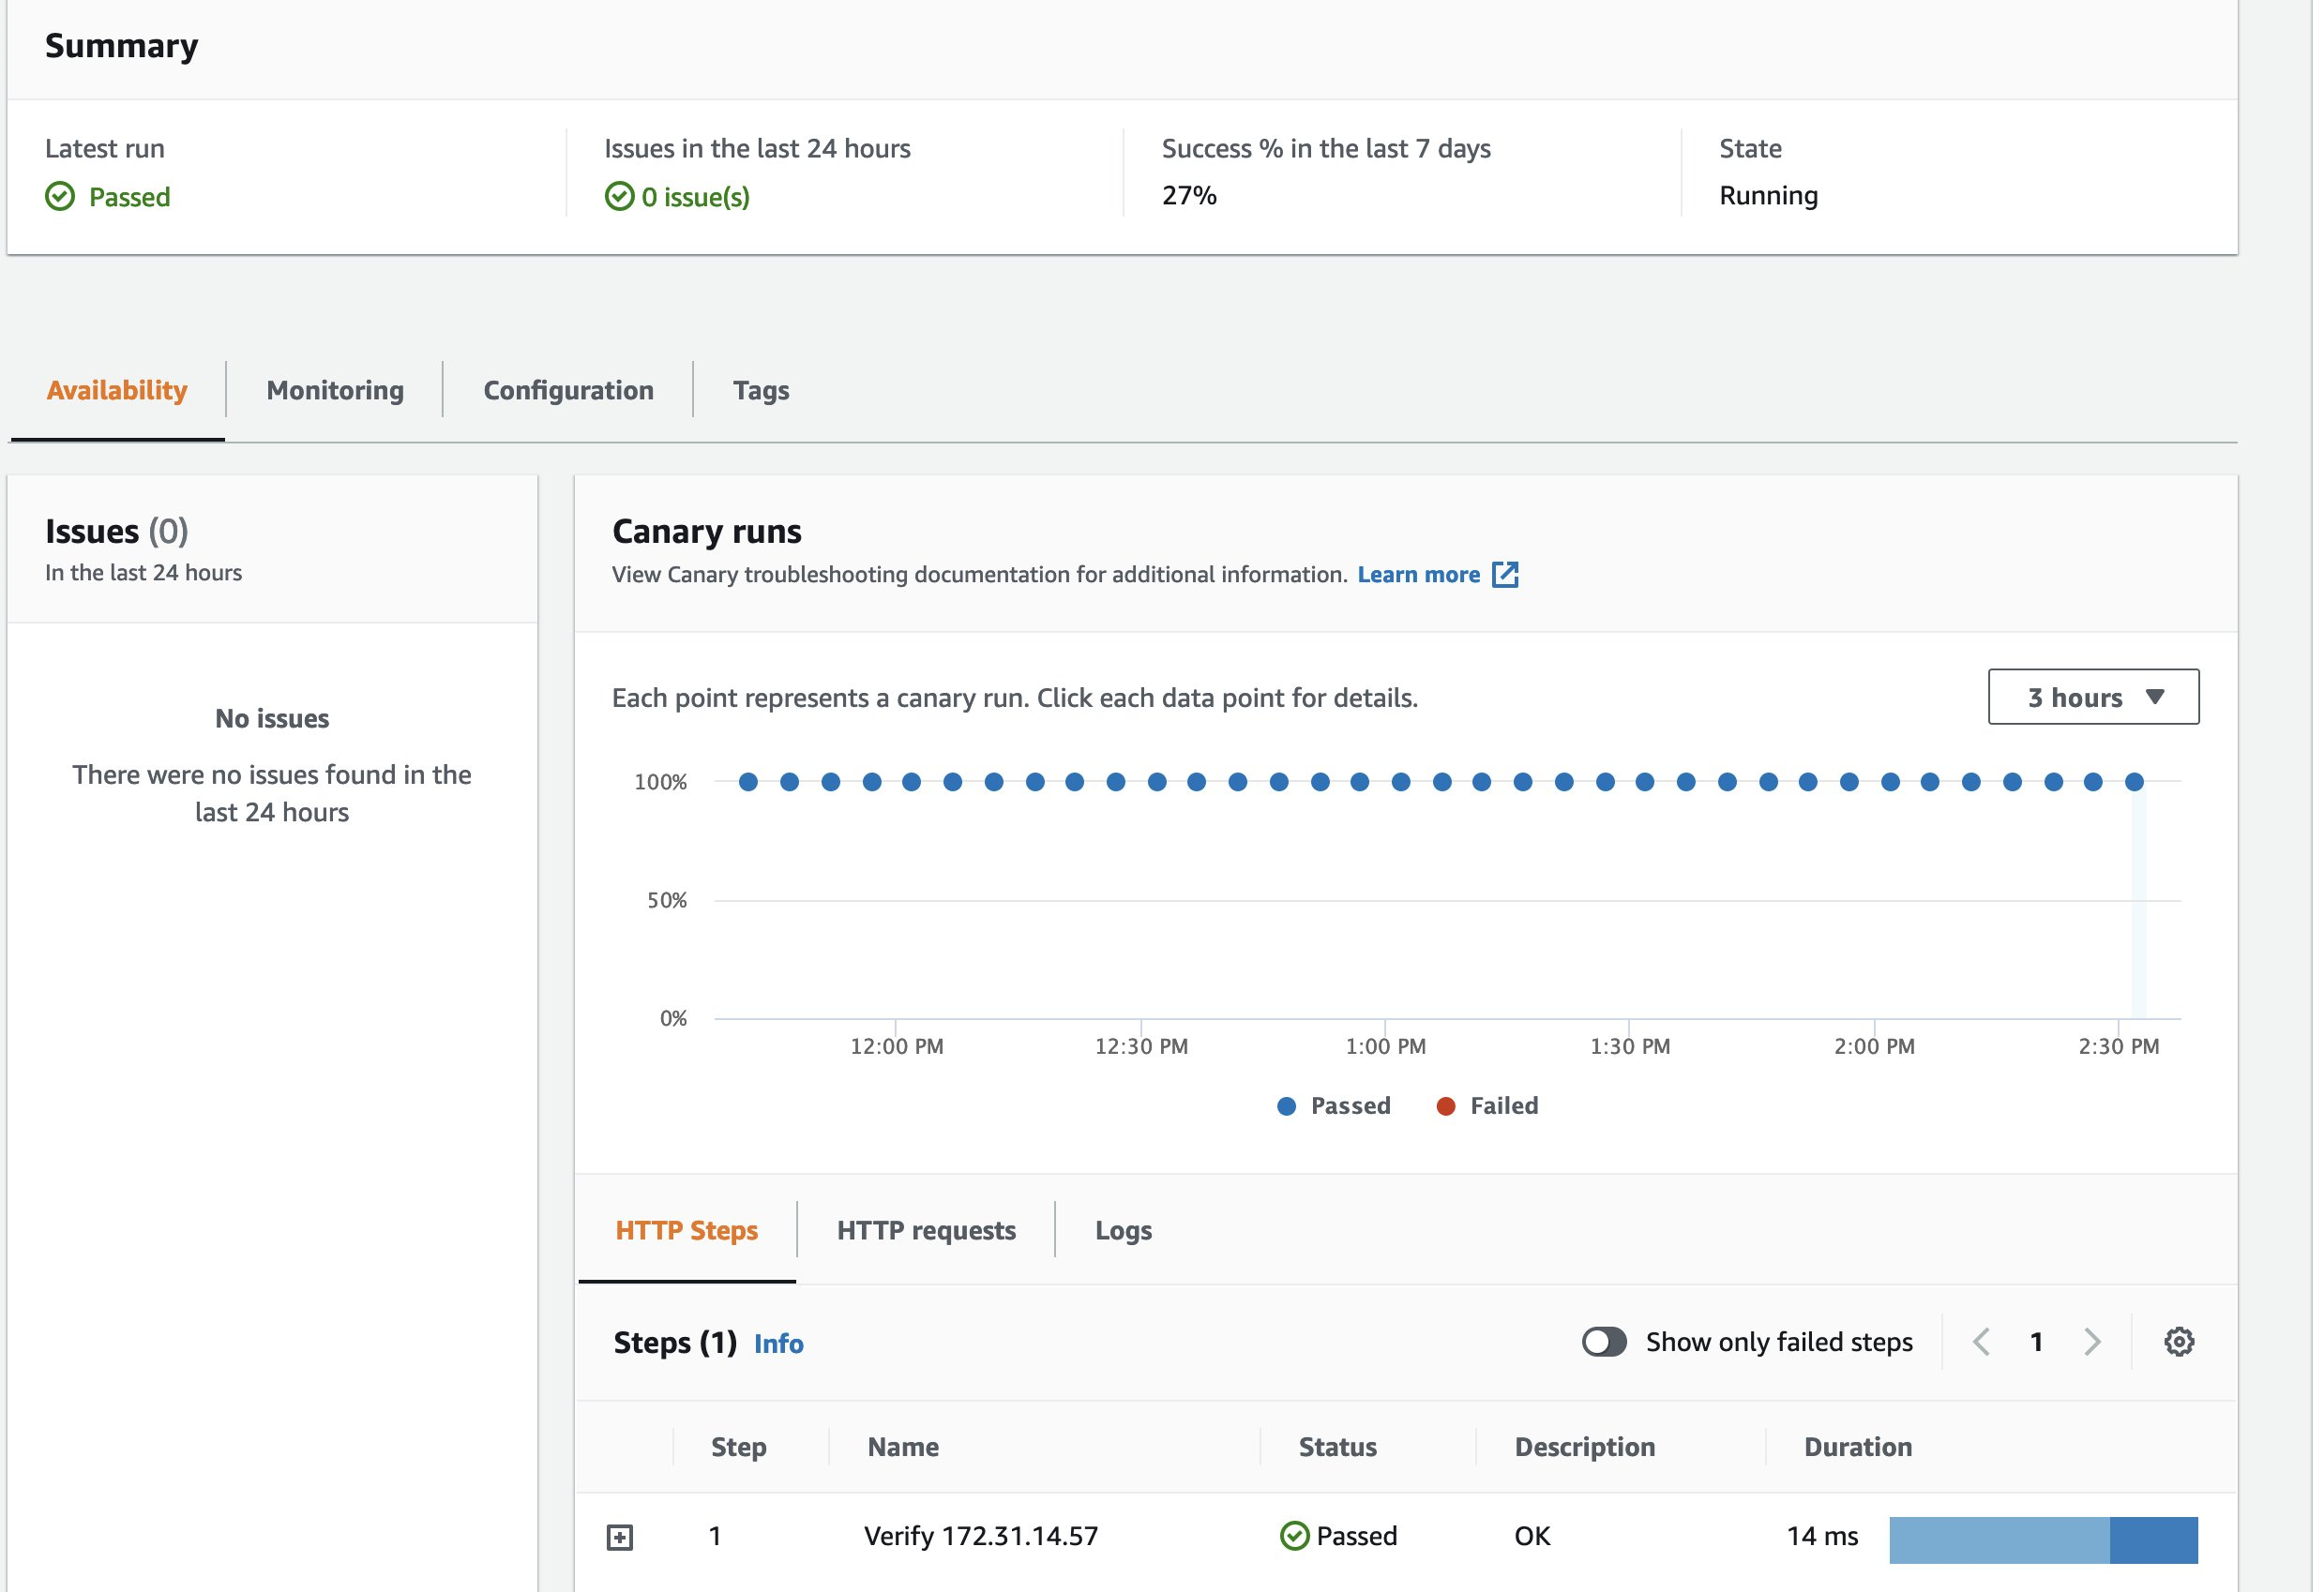
Figure 4. Successful configuration of Synthetic canaries
In addition, the following figure shows the different metrics emitted by CloudWatch Synthetics that can be used to monitor the availability and health of the on-premises application.
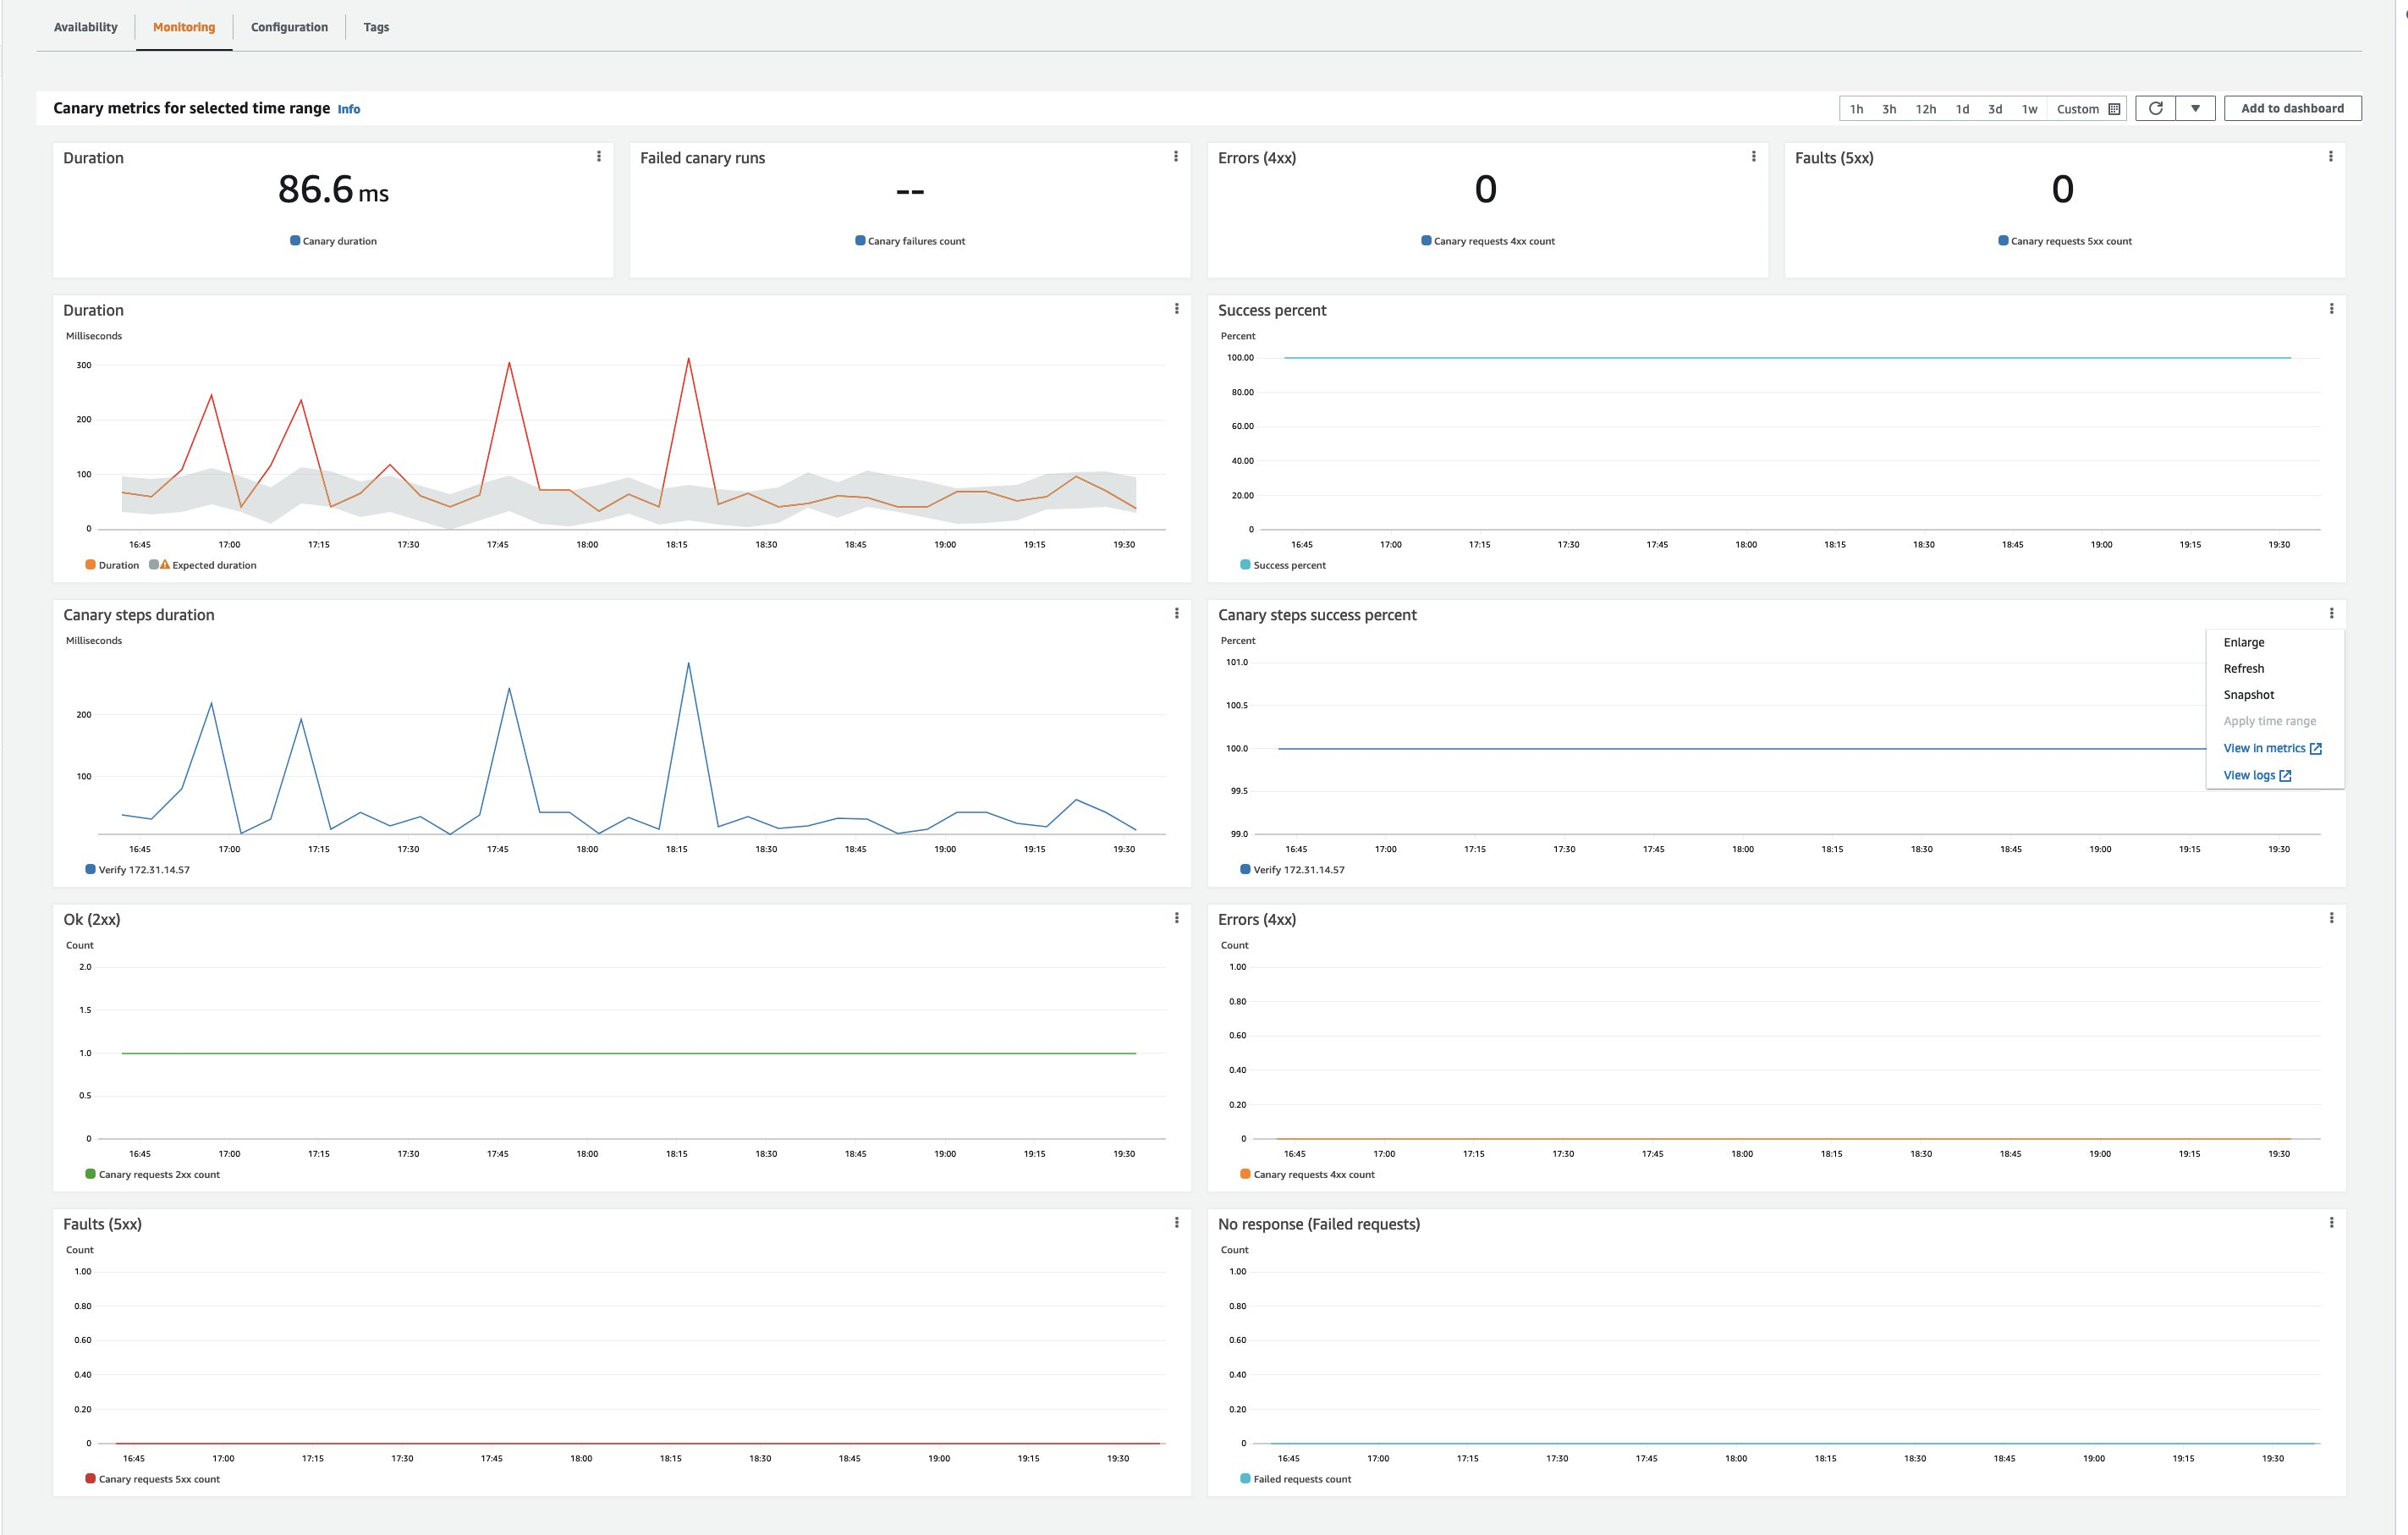
Figure 5. Different metrics emitted by CloudWatch Synthetics
Cleanup
- Open the CloudWatch console.
- Select the canaries you created and from Actions, select Stop. Repeat this step for every region. This step is needed only if there are active canaries in the Running state.
- Open the Amazon S3 console, and choose all of the buckets that start with ‘my-synthetics-‘. Empty the bucket contents.
- Within the Amazon Route 53 console, delete your outbound endpoint and delete your forwarding rules.
- Delete any VPC resources and VPC endpoints, along with private connections like Site-to-Site VPN.
Conclusion
In this post, we used CloudWatch Synthetics residing in a VPC to route to an on-premises network via a private connection over Site-to-to VPN or Direct Connect. You can also use CloudWatch Synthetics to provide insights into your on-premises application. These insights in the form of metrics and alarms can be utilized in your centralized CloudWatch Dashboard that acts as single view for monitoring AWS and on-premises resources.
In addition, you can use CloudWatch Synthetics to monitor individual web pages, multi-page web workflows such as wizards and checkouts, and API endpoints, with metrics stored in CloudWatch. You can set CloudWatch alarms so that you’re notified when thresholds based on performance, behavior, or site integrity are crossed. To learn more about CloudWatch Synthetics, contact us on info@cloudsolutionstech.com.